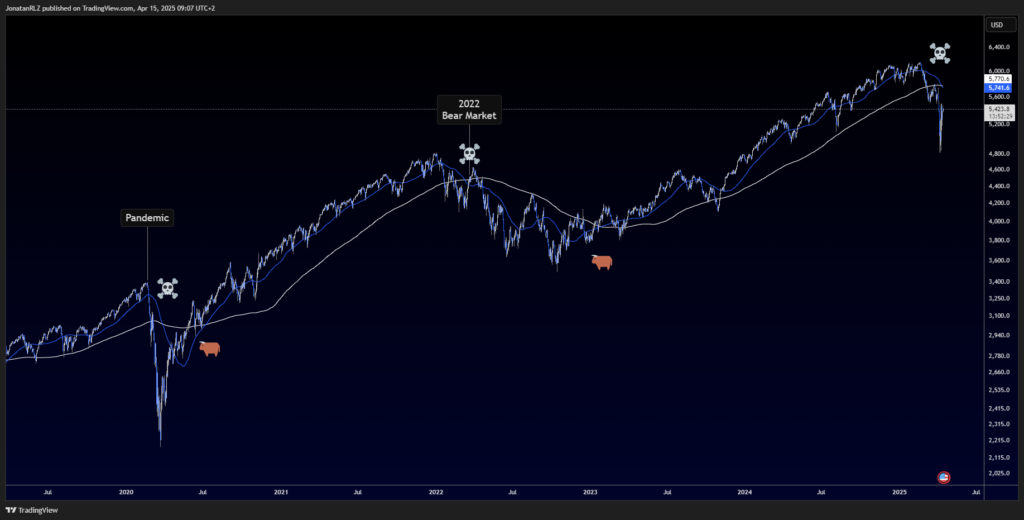
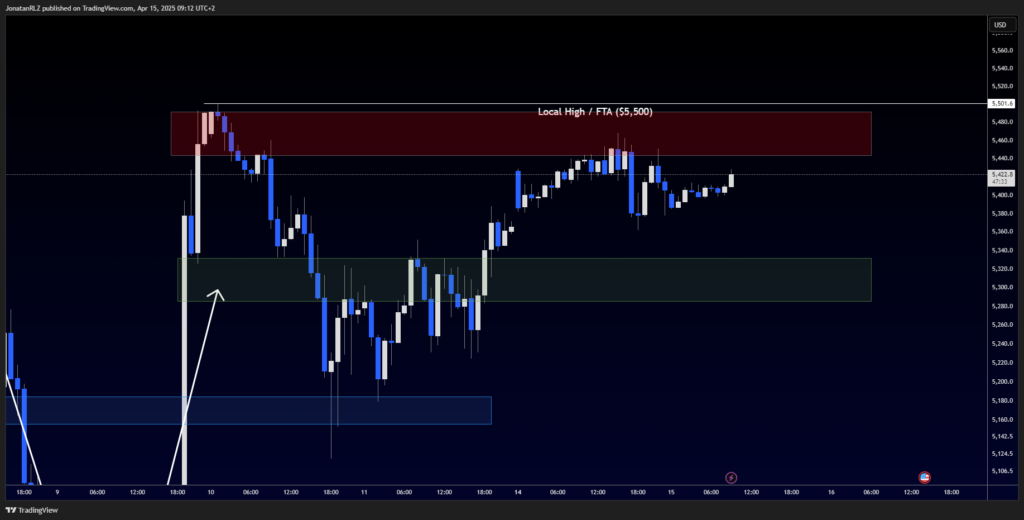
The S&P 500 continues to trade within a well-defined range, with short-term support around 5,300 and high timeframe resistance at 5,500. Until one of these boundaries is broken, price action may remain contained within this zone. With limited major news scheduled for the week, broader catalysts appear to be lacking—leaving the index potentially range-bound for now.
Before diving into the intraday picture, it’s worth stepping back to look at the longer-term trend. On the daily chart, the 50-day and 200-day Simple Moving Averages have now officially printed a death cross, with the 50 SMA crossing below the 200 SMA on the close of yesterday’s candle.
A death cross is often interpreted as a potential sign of bearish momentum, and historically, it has coincided with significant turning points—such as the 2020 pandemic correction and the 2022 bear market. Conversely, golden crosses, where the 50 SMA crosses above the 200 SMA, have marked recoveries and trend shifts in the past.
That said, looking at the entire historical context of the S&P 500, there’s no consistent statistical edge in using the death or golden cross alone as a reliable long-term signal. These crosses are lagging indicators by nature and are best used in conjunction with broader technical and macroeconomic context.
With tariffs and global trade uncertainty weighing on market sentiment, it’s not surprising to see the moving averages shifting once again. Whether this recent death cross leads to a larger downside move—or proves to be a false signal—remains to be seen. For stronger confirmation, multiple daily closes beneath this crossover would help validate the shift in trend.

Intraday Update – 1H Chart
On the 1-hour chart, the S&P 500 remains comfortably range-bound between 5,300 as support and 5,500 as resistance. This structure has held firmly over recent sessions, and as of now, there’s no clear indication of breakout or breakdown.
A break of either boundary would represent a notable shift in short-term trend structure. Specifically, a break and sustained hold above 5,500 could potentially challenge the implications of the recently printed death cross—much like a failed breakout pattern can invalidate its initial signal.
That’s the quick intraday view for today. Thanks for reading, and make sure to check back tomorrow for fresh updates on both the higher and lower timeframes.

The financial products offered by the Company are complex and come with a high risk of losing money rapidly due to leverage. These products may not be suitable for all investors. Before engaging, you should consider whether you understand how these leveraged products work and whether you can afford the high risk of losing your money.
The Company does not accept clients from the Restricted Jurisdictions as indicated in our website/ T&C. Some services or products may not be available in your jurisdiction.
The applicable legal entity and its respective products and services depend on the client’s country of residence and the entity with which the client has established a contractual relationship during registration.


