Markets are starting the week under pressure as uncertainty around global trade tensions continues to weigh on sentiment. You’ll see price action across risk assets like Bitcoin and the S&P 500 painting a more cautious picture. In today’s update, we’ll break down the most interesting price levels and what to watch for today and the coming days.
S&P 500 (SPX)
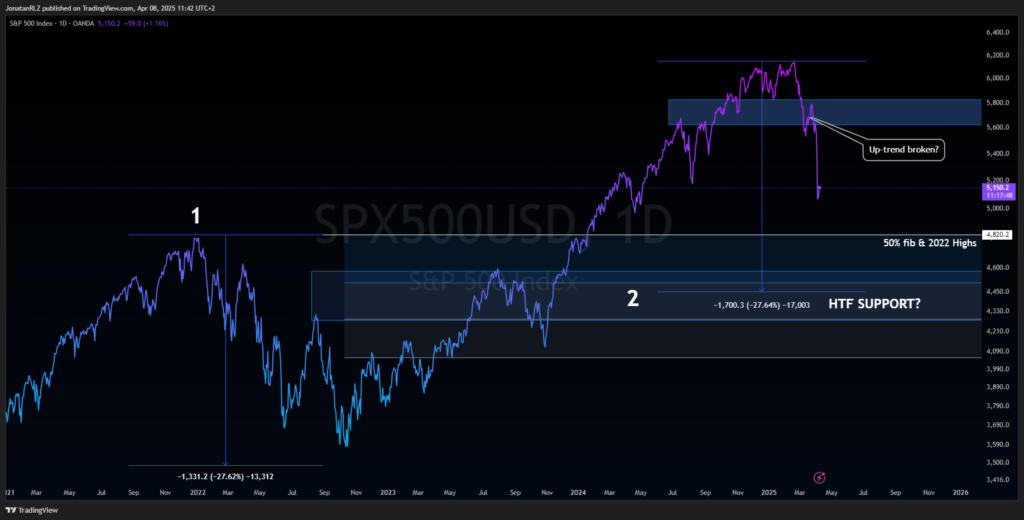
Looking at the S&P 500 on the daily timeframe using a line chart gives us a cleaner perspective by removing the noise from wicks. When we take a more zoomed-out, high timeframe view, it becomes clear that once price broke below the 5,600 level, we’ve officially formed a pattern of lower highs and lower lows—a classic signal that the uptrend may have broken.
After a strong, high-volatility move like this, it’s common to see a short-term bullish reaction, but the bigger question remains:
Is this just a temporary pullback within an overall uptrend, or are we witnessing the beginning of something much more significant?
Looking back at the January 2022 break of structure (marked with a “1” on the chart), the S&P 500 went on to decline over 27%, entering a full bear market. With recession fears elevated once again, we can’t rule out the potential for a similar move.
If this move develops into a deeper correction, the first key level to watch is 4,820—a confluence zone combining the 50% Fibonacci retracement and the 2022 highs. This area marks a major untested breakout level and could act as Support 1. Should that level fail, the next significant downside target sits near 4,500, which aligns with the 0.618 Fibonacci retracement measured from the October 2023 low to the 2025 all-time high, making it a critical Support 2 zone in a potential bear market scenario.
These are key HTF levels to monitor. If this move turns into a deeper correction, 4,820 and 4,500 are areas where the market could form a long-term bottom—especially if macro conditions deteriorate further and recession risks begin to materialize.
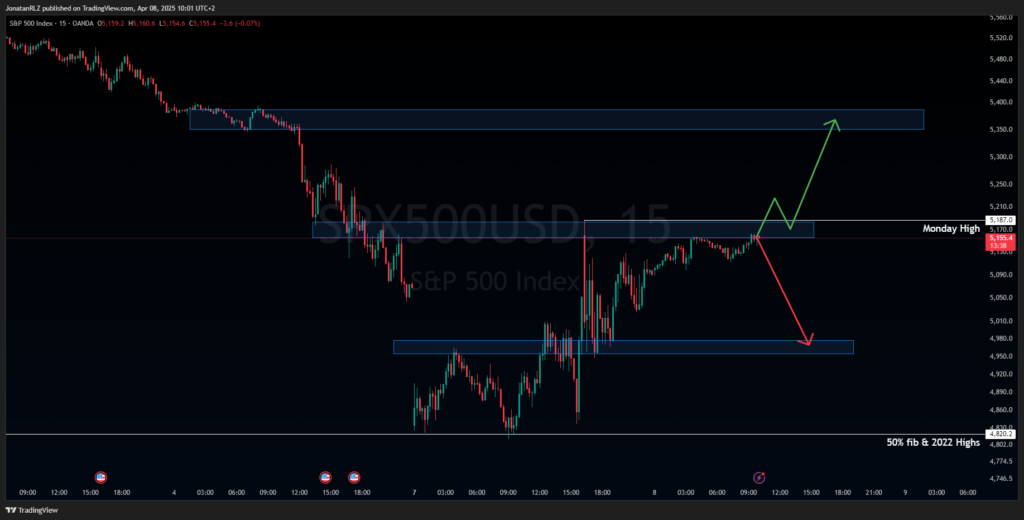
Shifting to the intraday view on the 15-minute timeframe using candlesticks, we can see more detail in how price is reacting at these critical zones. While the line chart showed a clean breakdown, the candlestick chart reveals that on Monday, price actually wicked down and tested the 50% Fib and the 2022 highs—an important distinction that highlights the difference between the line chart and the candlestick chart.
After filling the weekend gap, price is now slowly making its way back up to potentially retest the Monday high, around 5,180. This is a key resistance zone in the short term. A rejection at this level, especially into the U.S. open, would suggest continued weakness and could trigger an intraday move back toward 5,000.
On the flip side, if the market reclaims the Monday high, that would be a short-term signal of strength. While it may only be temporary, early signs of a macro reversal often show up first on the lower timeframes. Should bulls take control here, the next area of interest to the upside is 5,350—the first trouble area where supply is likely to show up.
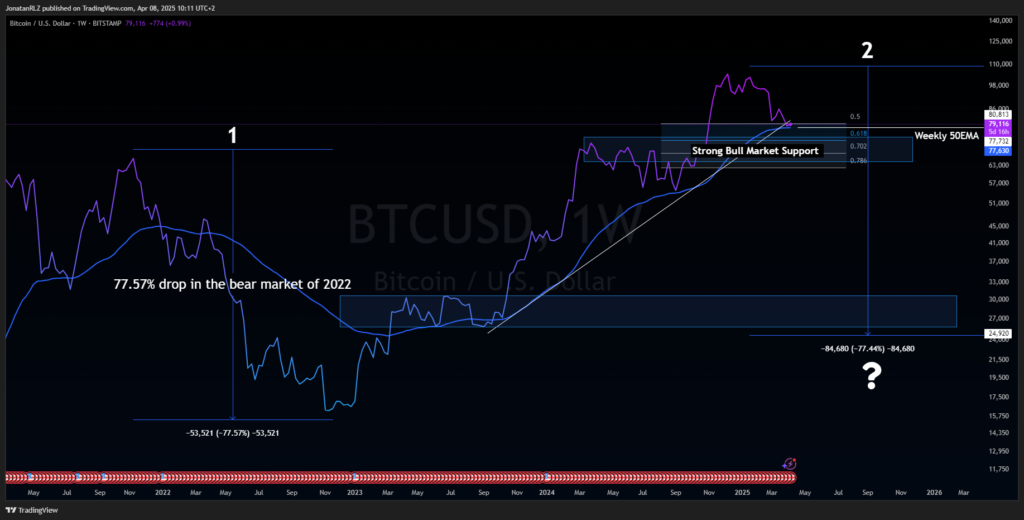
Moving on to Bitcoin, which has shown remarkable strength considering the current macro environment, especially in contrast to how global equities have reacted to the recent tariff announcements. In this analysis, we’re again using the line chart to reduce noise and focus on the broader structure.
Bitcoin is currently holding above the weekly 50 EMA, marked as the blue line on the chart. We’re also trading right around the 50% Fibonacci retracement from the latest leg up in this bull market. While we have lost an important trend line, it’s key to understand that trend lines are rarely perfect. They function more like buffer zones rather than exact levels—so we’re still holding this broader support cluster.
This cluster includes:
- The weekly 50 EMA
- The 50% Fib retracement
- And the trend line zone
Zooming out, we also have a major support area around $65,000–$70,000, roughly 15% below current price. This zone aligns with the 0.618 to 0.786 Fibonacci retracement of the broader move and historically serves as a strong support area during bull markets.
If the risk-off narrative continues and U.S. equities push lower, we could see Bitcoin dip into that zone. The bulls may see this area as a high-probability accumulation opportunity—assuming we are still within a broader uptrend.
That said, we must always consider the bear case. Back in 2022 (marked with a “1” on the chart), Bitcoin experienced a 77% drawdown. If a similar decline were to unfold again, in the event of a true bear market and a global recession, we’re looking at a possible revisit of the $25,000–$30,000 zone—another historically strong support area.
We’re not there yet, and we would first need to break convincingly below the $70,000 region for that scenario to become realistic. But it’s always important to map both paths and prepare accordingly.
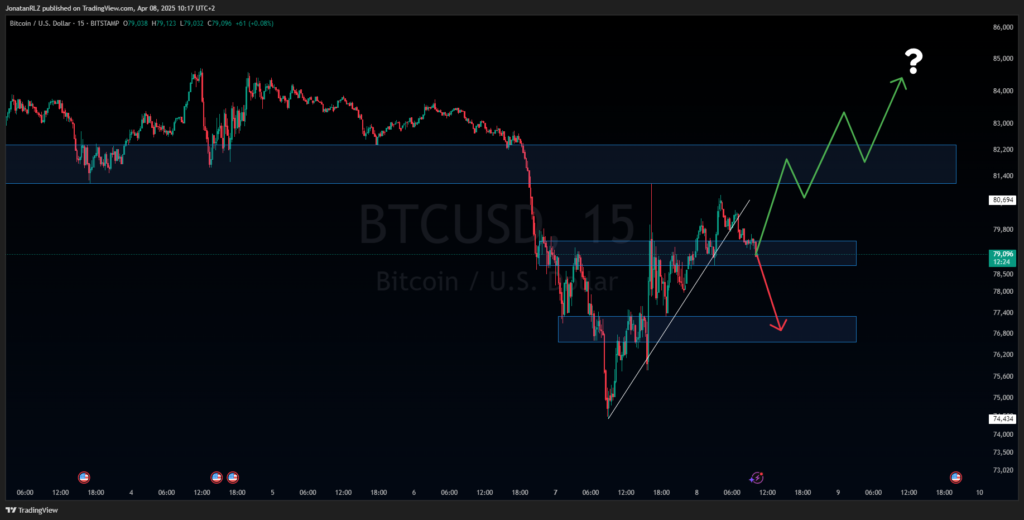
Zooming in to the 15-minute timeframe, Bitcoin is showing a structure similar to what we’re seeing in the S&P 500—potential signs of a low time frame top formation. However, it’s important to note that this is not confirmed until we see a clean break below the $78,750 level, which is currently being tested as support.
A breakdown below this level could trigger a move down toward support at the $77,000 area, where the next logical demand zone sits. On the other hand, if $78,750 holds, we could see a push up toward the $81,500 area—a key short-term resistance zone.
A reclaim of $81,500 would be a strong intraday signal that Bitcoin is regaining momentum. That kind of breakout would shift the structure back in favor of the bulls and could even open the door to adding to longer-term positions, especially as we approach higher timeframe resistance levels.
As always, keep in mind that short-term moves often act as the first clues for bigger directional shifts. Watching how Bitcoin behaves around these intraday levels will provide key insight into where we’re headed next.
Thank you for reading today’s technical analysis update.
Make sure to check back daily for fresh market insights and the key levels to watch across major assets. Stay sharp, stay disciplined, and stay tuned as we navigate the ever-evolving world of trading.
The financial products offered by the Company are complex and come with a high risk of losing money rapidly due to leverage. These products may not be suitable for all investors. Before engaging, you should consider whether you understand how these leveraged products work and whether you can afford the high risk of losing your money.
The Company does not accept clients from the Restricted Jurisdictions as indicated in our website/ T&C. Some services or products may not be available in your jurisdiction.
The applicable legal entity and its respective products and services depend on the client’s country of residence and the entity with which the client has established a contractual relationship during registration.

