Understanding candlestick patterns and technical indicators, are essential for traders looking to gain insights into market sentiment and make informed trading decisions. Among the many popular candlestick formations, the spinning top pattern stands out for its unique characteristics and potential to show you the upcoming market direction.
In this article, we look at the specifics of the spinning top candlestick pattern, explore its definition, formation, and significance in technical analysis. By comprehensively dissecting this pattern, traders can add to the tools they have available to them, enhance their analytical skills, and navigate the complexities of the financial markets with greater confidence.
Whether you’re a novice trader trying to understand the basics or an experienced investor aiming to refine your trading strategies, understanding this candlestick pattern is extremely useful to succeed in an extremely active trading landscape. Join us as we look into this valuable candlestick formation and use its potential to help you capture opportunities on the markets.
Key takeaways
- Candlestick patterns are essential tools for traders, providing insights into market sentiment and guiding trading decisions
- The spinning top candlestick pattern, with its unique characteristics, holds significance in technical analysis for discerning market direction
- Understanding the formation and implications of the pattern empowers traders to enhance their analytical skills and make informed trading decisions in dynamic market environments
Understanding the spinning top candlestick
The spinning top candlestick chart pattern develops when buyers and sellers reach an equilibrium, leading to minimal changes between opening and closing prices. This subtle shift is usually called a continuation pattern in trading terminology.
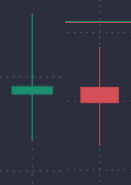
Within this pattern, two variations exist: the bullish spinning top, depicted in green, and the bearish spinning top, indicated in red. The bullish scenario unfolds when the closing price surpasses the opening price, while its bearish variation materializes when the opening price exceeds the closing price.

The anatomy of a spinning top

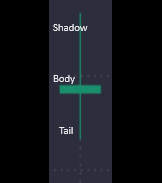
Much like other candlestick formations, a spinning top candlestick is composed of a shadow, body, and tail. Sometimes the shadow and tail are also called the wicks. The significance, though, has to do with the length and their relationship to each other. Since this candle shows the push and pull of buyers and sellers, you will notice that more often than not, the shadow and the tail (or the upper and lower wick) are almost equal, i.e. the distance the price has moved is equal in both directions away from the body, so there was equal volume of buyers and sellers on both sides of this movement.
Reading market signals: what does a spinning top tell traders?
The spinning top pattern reflects an uncertainty within the market, with the candlestick patterns long upper and lower shadows indicating little change between the closing and opening price. Despite bullish and bearish pressures, the price ultimately settles near its opening price, hinting at potential indecision or a pause in the prevailing trend.
This indecision shown by the spinning top chart pattern could imply further sideways movement, particularly within an established trading range, or potentially signal a reversal following a significant price move.
At times, the spinning top candlestick pattern may mark pivotal trend shifts. A spinning top appearing at the uptrend peak may suggest waning bullish momentum and a possible trend reversal. At the same time, its presence at the downtrend bottom could signify weakening bearish control, potentially paving the way for a bullish breakout.
Confirmation from subsequent candlesticks is crucial in accurately interpreting the spinning top candlestick pattern. Traders await confirmation in the form of price action following the spinning top. For instance, a reversal anticipated after an uptrend spinning top should see prices declining in the subsequent candle. Conversely, traders must exercise caution and await further confirmation signals if the expected reversal fails to materialise. A confirming candlestick would typically stay within the established sideways channel in a ranging market, reinforcing ongoing indecision.
While spinning tops are a prevalent candlestick pattern, they are most effectively used alongside other technical analysis tools. Incorporating indicators such as MACD or RSI, as well as identifying support and resistance levels, can provide additional insights to complement spinning top candlesticks signals, aiding traders in making well-informed trading decisions and avoiding false signals.
Context is key: analyzing spinning tops within market trends
When encountering the spinning top pattern, traders have several options to consider. A crucial initial step involves confirming the signal’s validity. Many traders turn to technical indicators to corroborate the signal given by the spinning top beyond the opening and closing price movements, as these indicators offer deeper insights into price dynamics.
For instance, if a spinning top appears at the downtrend’s end, suggesting a potential reversal, traders might use the stochastic oscillator to validate the signal.
This indicator gauges market momentum and velocity within a specified timeframe, aiding in price movement predictions. Upon confirmation of the impending reversal, traders may initiate a long position hoping for an uptrend.
To execute trades based on the spinning top candlestick pattern, derivatives such as spread bets or CFDs offer viable options. In derivative trading, ownership of the underlying assets is not transferred; traders speculate on price fluctuations.
This enables participation in bullish and bearish markets, allowing traders to capitalise on opportunities following spinning tops indicating upward or downward price movements.
This is the perfect set of options when trading a spinning top, since it can be an indicator of a bearish or bullish reversal, a trend continuation or a signal of a sideways movement. Having all options available to you allows you to trade in any direction the market may move in.
Trading strategies based on the spinning top candlestick
The most straightforward way to trade a spinning top is to go short if the signal shows an impending reversal of a bullish trend and go long if the signal shows a reversal of a bearish trend. Using stop loss and take profit can protect you, but that is easier said then done when using spinning top candlesticks.
Navigating stop loss and take profit levels with spinning tops can pose challenges compared to other chart patterns. Unlike some patterns that provide clear guidance, spinning tops may not offer distinct signals for setting these limits.
Some traders opt to use the boundaries of the wicks to determine stop loss placement – placing it at the top of the upper wick for short trades and at the bottom of the lower wick for long trades. However, this approach may prove too rigid or expose traders to excessive risk, depending on the pattern’s formation.
As previously discussed, spinning tops are most effective when complemented with other patterns and indicators. Therefore, seeking alternative sources for trade parameters is advisable. Incorporating additional technical analysis tools and patterns can provide supplementary guidance, ensuring a more comprehensive approach to setting stop loss and take profit levels in spinning top scenarios.
Combining spinning tops with technical indicators
Pairing spinning tops observations with complementary technical indicators and analysis methods can enhance decision-making in trading. Remember that this candlestick pattern represents indecision, so false signals are a strong possibility. Here are several indicator to help you avoid this:
- MACD (Moving Average Convergence Divergence): MACD helps identify momentum and trend direction changes. When combined with spinning tops patterns, traders can look for divergences between MACD and price movements, providing additional confirmation of potential trend reversals signaled by spinning tops.
- RSI (Relative Strength Index): RSI indicates overbought or oversold conditions in the market. When a spinning tops form at extreme RSI levels, it can strengthen the signal for a potential reversal. Traders may wait for RSI divergence or confirmation to validate the spinning tops pattern.
- Fibonacci Retracement levels: Fibonacci retracement levels help identify potential support and resistance zones based on key Fibonacci ratios. Traders can use Fibonacci levels with spinning tops to identify areas where price reversals are likely to occur, providing valuable entry and exit points.
- Volume analysis: analysing trading volume alongside spinning tops can provide insights into the strength of market participants’ conviction. High volume accompanying spinning tops may indicate increased uncertainty or indecision, while low volume may suggest a lack of commitment to the prevailing trend.
- Support and Resistance levels: identifying significant support and resistance levels on price charts can complement spinning top observations. When a spinning top forms near a critical support or resistance level, it adds credibility to the potential bullish or bearish reversal signal.
- A more common candlestick pattern: observing an other chart pattern in conjunction with spinning tops can provide confirmation or additional context for trading decisions. For example, a spinning top followed by a bearish engulfing chart pattern strengthens the bearish signal, while a spinning top followed by a bullish engulfing pattern reinforces the bullish bias.
By combining spinning top observations with these technical indicators and analysis methods, traders can gain a more comprehensive understanding of market dynamics and make more informed trading decisions.
The challenges of trading on spinning top patterns
Trading on spinning tops presents challenges due to their ambiguous nature. Determining stop loss and take profit levels can be difficult, as these patterns offer limited guidance.
Traders may rely on supplementary technical indicators and analysis methods to confirm signals and mitigate risks associated with trading based solely on spinning top observations.
Spinning top patterns trading examples

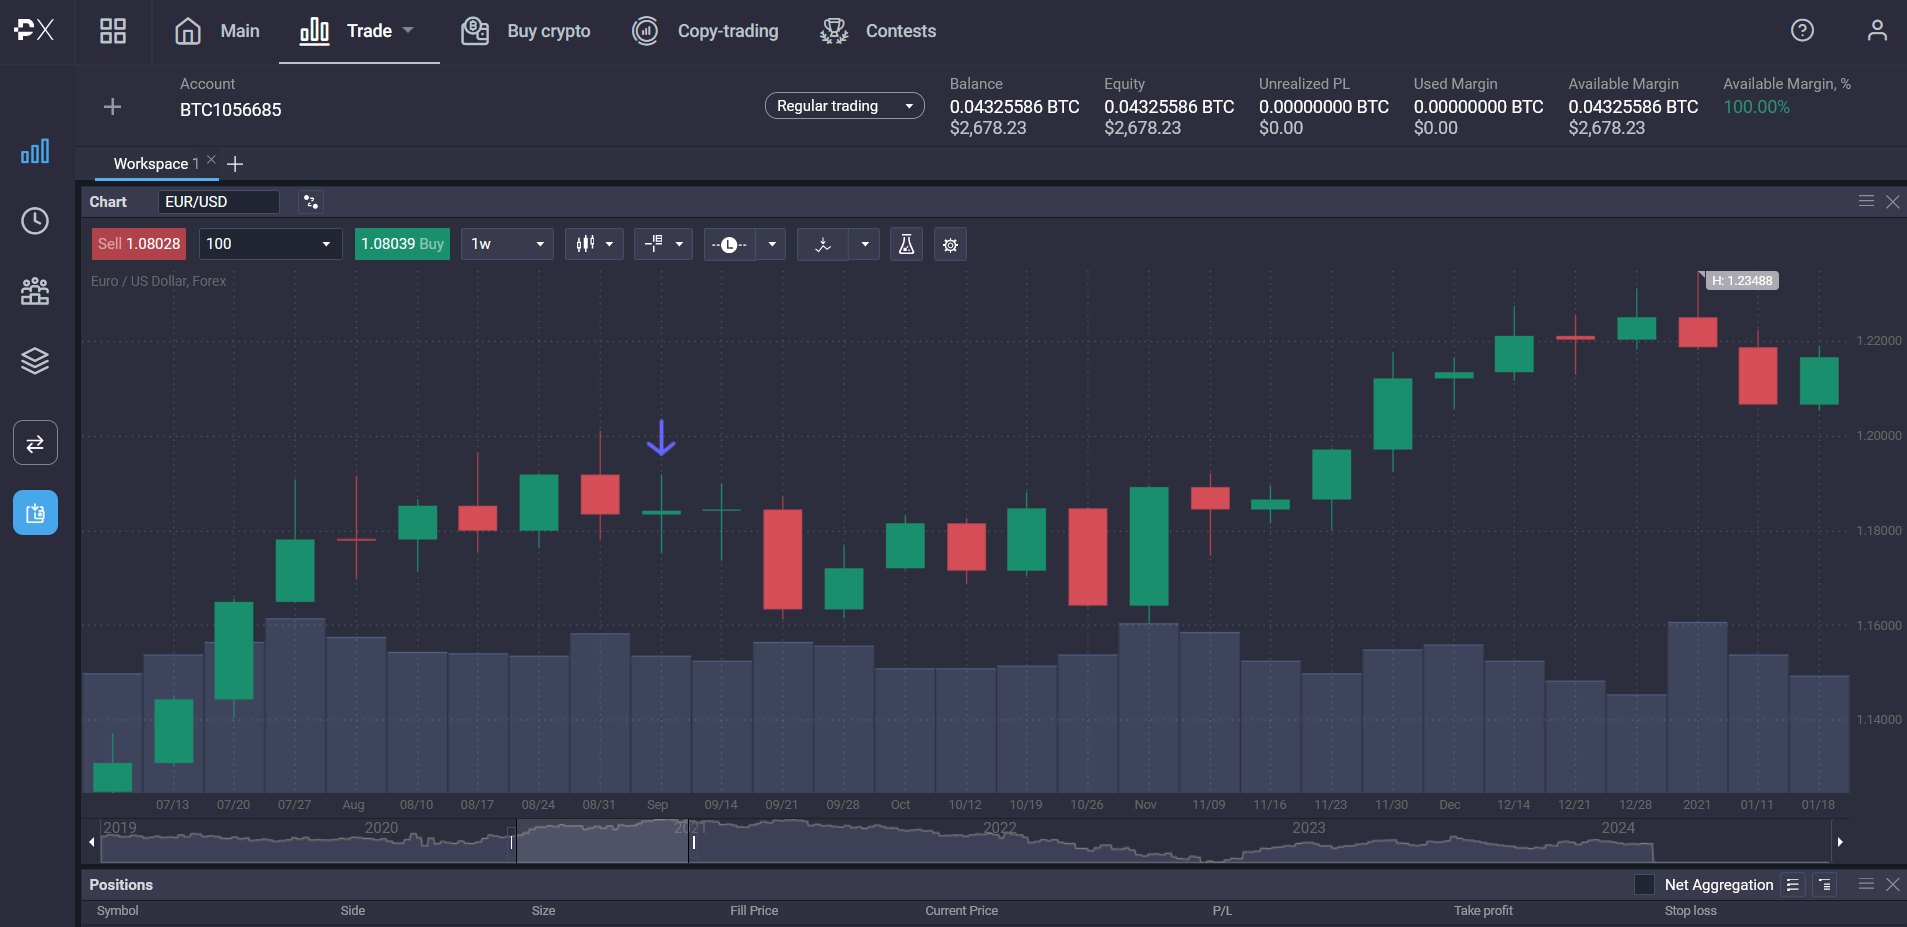
The pattern is marked by small bodies and long upper and lower shadows, illustrate market indecision. In an uptrend, a spinning top forms, signaling potential bullish exhaustion.
Conversely, in a downtrend, another top emerges, indicating possible weakening bearish momentum. These patterns often precede significant price reversals or consolidation phases.
Conclusion
In conclusion, understanding candlestick patterns like the spinning top is crucial for informed trading decisions. Delving into its formation and implications enhances analytical skills, offering valuable insights into market dynamics.
Whether novice or experienced, mastering this pattern equips traders to navigate the financial markets with confidence and seize lucrative opportunities.
What does a spinning top candle indicate?
They usually indicate a reversal or a trend continuation.
What is the difference between a spinning top and a high wave candle?
A spinning top has a small body and long shadows, showing market indecision, while a high wave candle reflects market volatility.
Is a Doji and spinning top candle the same thing?
No, a Doji has no body with equal open and close, while a spinning top has a small body with long shadows.
Is a spinning top bullish?
It can be both bullish, bearish or signal a trend continuation.
The content provided here is for informational purposes only. It is not intended as personal investment advice and does not constitute a solicitation or invitation to engage in any financial transactions, investments, or related activities. Past performance is not a reliable indicator of future results.
The financial products offered by the Company are complex and come with a high risk of losing money rapidly due to leverage. These products may not be suitable for all investors. Before engaging, you should consider whether you understand how these leveraged products work and whether you can afford the high risk of losing your money.
The Company does not accept clients from the Restricted Jurisdictions as indicated in our website/ T&C. Some services or products may not be available in your jurisdiction.
The applicable legal entity and its respective products and services depend on the client’s country of residence and the entity with which the client has established a contractual relationship during registration.


