The Doji candlestick shows a lack of conviction and that the market is trying to figure out its next move. While markets don’t sit still forever, they do occasionally take breaks. Because of this, this candlestick can give you an idea of when the market is trying to make a move or perhaps even when it has changed its mind.
Although there are several different types, the common thread with all Doji candlesticks is that the body is either unchanged or shows an extraordinarily small range. They also can suggest that something is happening within the market to indicate a move is coming.
What Does the Doji Candle Look Like?
A Doji candlestick is a neutral candlestick. It means there is no decision, so the candle’s body is thin. There is no real strength on one side or the other. There are a couple of different looks to a Doji.
- Green Doji – This candlestick has a small but green body. This shows a very slight leaning toward the upside, but you cannot read too much into this until the continuation moves.
- Red Doji – This candlestick has a small but red body. This slightly leans toward the downside, but you cannot read too much into it until the continuation moves.
- Long shadows – This candlestick has a small body showing indecision but also long shadows offering plenty of volatility. This means that a big move could be coming.
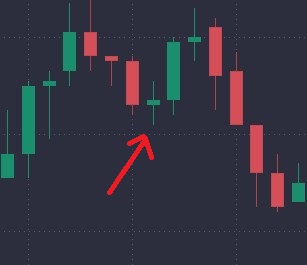
A green Doji on the PrimeXBT platform.
Types of Doji Candlestick Pattern
Although the Doji candlestick is neutral, this does not mean that there are no variations. Some of them can give clues and hints as to where the market might be looking to go next. By recognizing these different types of Doji candlesticks, you can get an idea of what has been going on in the market internally.
Neutral Doji
The “Neutral Doji,” or the type most commonly thought of as a Doji, is a candlestick with relatively small shadows with an entire or almost unchanged body. This suggests that the market has no idea what to do with itself. You can also see these when the market is waiting for an announcement.
You must check your favorite economic calendar before trading these candlesticks because they may lull you into a false setup. For example, if the Non-Farm Payroll announcement in the US is coming out in a few hours, the Doji candles, more often than not, will show that there isn’t much interest in the market. However, just because the market “drifts” higher or lower doesn’t mean that’s the actual trend. The announcement will determine that.
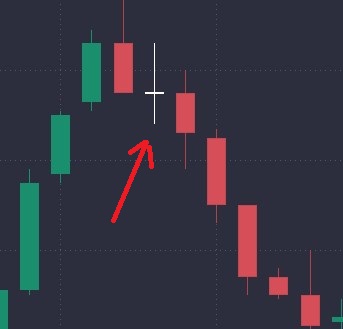
A neutral Doji Candle on the PrimeXBT platform.
Long-legged Doji
The Long-Legged Doji is a candlestick with either a neutral body or a tiny one. However, in this case, long shadows on both sides of the body suggest a lot of volatility in the market, and we could be getting ready to see a more significant move.
The biggest takeaway is that the volatility suggests that there was a big fight between the bears and the bulls during this period, and somebody sooner or later is going to lose. When they do, they will have to cover their positions, putting more pressure on whatever direction we break out.
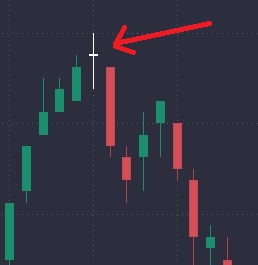
A long-legged Doji on the Prime XBT platform.
Dragonfly Doji
The “Dragonfly Doji” has a neutral body with a long wick or shadow underneath it. When looked at, it is similar to the shape of a dragonfly, as seen from above. This suggests that there were plenty of buyers to support the market. This is almost identical to the hammer candlestick.
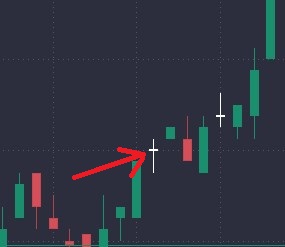
A “Dragonfly Doji” on the PrimeXBT platform.
Gravestone Doji
The “Gravestone Doji” is the exact opposite of the Dragonfly Doji. It has a neutral body, a long wick above, suggesting that the sellers exert pressure and that we may run out of upward momentum. This is almost identical to the shooting star candlestick.

A “Gravestone Doji” is called so because it is bearish and looks like a gravestone from the side. PrimeXBT platform.
4 Price Doji
The 4 Price Doji is rarely seen. The open, close, high, and low are almost the same price. This results in a candlestick that is simply a dash on your screen. In a market that moves 24 hours, it’s impossible to see this candlestick, but less liquid markets, such as those you might see in obscure commodities, can print these from time to time.
Some of the most common places to see this would be in futures contracts that are far out in time, as there may or may not be any trades on a given day. For example, a cotton contract that expires in 3 years won’t have many traders interested in it.
How Does Doji Candle Work and What Does it Tell You?
A Doji candlestick tells you that the market is hesitant at the moment, meaning that traders are not sure which direction they want to go. That being said, it’s essential to understand those market participants may have to reassess the situation.
By seeing these candlesticks, you know that the market is currently waiting for something or is indecisive. As a trader, most people will wait for the market to make up its mind and lunge in one direction. It is at that point that they place a trade. Think of this candlestick as a sign that something is about to happen, and it’s your job to wait for other participants to make up their minds.
How to use Doji Candlestick? Trading Strategies and Examples
While the ways to use the Doji candlestick are essentially limitless, there are a handful of strategies that many traders try to employ. The following three methods are simple, straightforward, and mechanical. These are strategies that you can test yourself to see whether or not they might fit your trading style.
Doji Launch Strategy:
The idea of this strategy is to wait until at least a couple of Doji candlesticks form, showing signs of hesitation in the market. You can even look at a couple of candlesticks, see the short-term range, and determine the directionality of the following trade based on a close outside of that range. The stop loss goes on the other side of the field, allowing you to have a mechanical and straightforward system.
Keep in mind that you can use this on short- and long-term charts, but with all other technical analysis-related things, it does tend to do better on higher time frames. This is because it takes much more volume and effort to keep a market in a relatively tight squeeze for a few days compared to a few minutes.
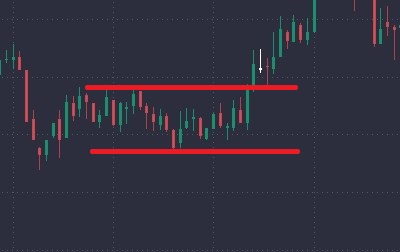
A “Doji Launch” on the PrimeXBT platform.
Fibonacci and Doji Strategy:
Traders commonly use Fibonacci retracements, and certain areas get a lot of attention. By pairing that with a Doji, you are waiting for the market to pull back to a specific Fibonacci level, perhaps the 38.2%, 50%, or even the 61.8% Fibonacci, and looking at the Doji candlestick as a sign of the market initiating its pullback. You enter on a break above the top of that candlestick and try to catch the next leg higher or lower, joining the longer-term trend.
Remember that not all Fibonacci levels are created equal. Sticking to those three most commonly followed does give the strategy a little bit more efficacy. Furthermore, recognizing that Fibonacci is on the 5-minute chart won’t necessarily be as informative as those on the daily chart.
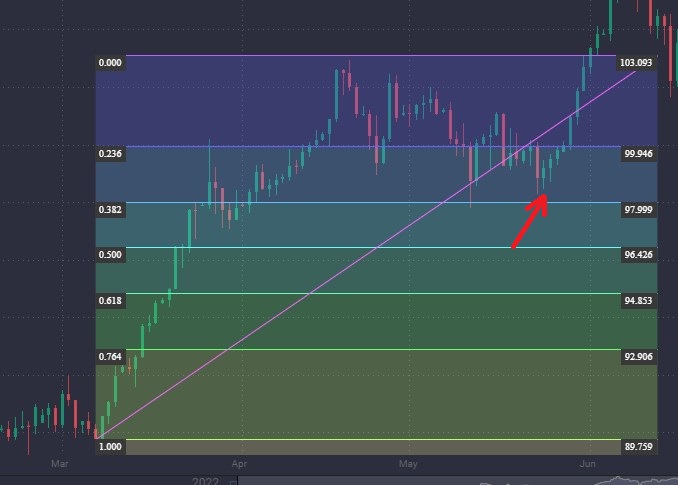
A couple of Dojis are shown on the PrimeXBT platform at a Fibonacci number.
Round Figure Doji Ledge:
Although not as common, a series of Doji candlesticks can sometimes form a “ledge” for the market to jump off. You hope to see a series of Doji candlesticks at a prominent, round, psychologically important figure. Some examples would be 1.15, 0.500, 1.20, or any other major figure that you may see, like $30,000. On a breakout or breakdown, you follow the trend.
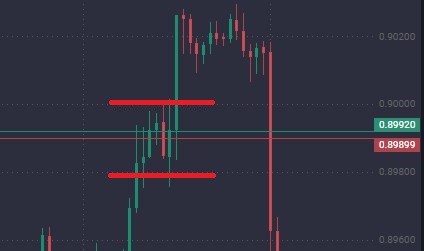
A series of Dojis and neutral candles on the PrimeXBT platform.
Double Doji Strategy
This is a two-candlestick strategy, as the name implies. It is when 2 Dojis in a row form. The idea is that once the market breaks in one direction, it signifies that traders have made up their minds about where things are going next.
In this scenario, you have a market waiting for something or fighting rather intensely. Once the market moves higher or lower, it has made up its mind, and it is your job to follow it. It’s worth noting that these happen quite a bit in shorter time frames, especially as markets wait for some economic announcement.
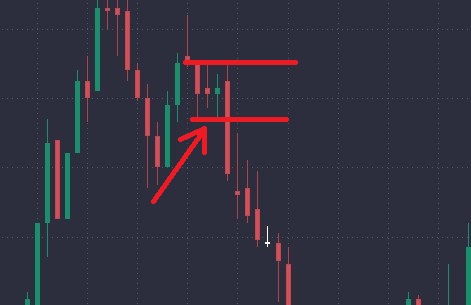
A “Double Doji” set up on the PrimeXBT platform.
The Pros and Cons of a Doji Candlestick
When using anything technical analysis related, there will be a certain amount of pros and cons to using it. As far as the Doji candlestick is concerned, these are some of the most noteworthy:
Pros
- Easily identifiable
- Shows that momentum could have an outsized effect on the market soon
- Can occur on any timeframe
Cons
- Not always the most reliable indicator
- Should be ignored on smaller time frames unless you have a lot of experience
- Can form due to external factors in the market
What does a Doji candle mean?
It means that neither the buyers nor sellers were in control for that period. It can signify an intense internal struggle or simply that the market is waiting for something.
What does a Doji candle indicate?
It shows a lack of conviction. This can be from a lack of buying or selling pressure or because the market is waiting for some confirmation.
Is a Doji candle bullish or bearish?
Neither. It shows indecision and is a very neutral attitude. It suggests the market hesitates, has equal pressure, or is waiting for an announcement. All of these can lead to an explosive move in either direction.
What do 2 or 3 Doji candles in a row mean?
It can mean that a more significant move is about to happen. This is because the momentum has stopped completely, and when a new shift in buying or selling pressure occurs, it can cause a run in that direction.
Quite often, this can lead to a new short-term trend that the market will follow. On larger timeframes, it can lead to big moves. However, these patterns tend to occur on shorter timeframes.
The content provided here is for informational purposes only. It is not intended as personal investment advice and does not constitute a solicitation or invitation to engage in any financial transactions, investments, or related activities. Past performance is not a reliable indicator of future results.
The financial products offered by the Company are complex and come with a high risk of losing money rapidly due to leverage. These products may not be suitable for all investors. Before engaging, you should consider whether you understand how these leveraged products work and whether you can afford the high risk of losing your money.
The Company does not accept clients from the Restricted Jurisdictions as indicated in our website/ T&C. Some services or products may not be available in your jurisdiction.
The applicable legal entity and its respective products and services depend on the client’s country of residence and the entity with which the client has established a contractual relationship during registration.

