There is a long list of strategies traders and investors use. Many of these investment strategies are based on theories speculating how asset prices tend to move.
Certain strategies assume that an asset’s price moves in cycles; others use the push and pull between support and resistance, others yet believe that all assets have a true market value and the price will return to that value eventually, using the distance between the current and price and the true market value to enter a trade. And just to make things even more challenging, all of these strategies are valid, depending on the market conditions and type of trading or investing.
As is expected, mean reversion trading, involves opening a trade when the price moves away from the asset’s average price. You would go short, or sell the asset if it’s above the average price and you would go long, or buy if the price is below the average price.
This article will walk you through mean reversion trading strategy, which uses the idea that all assets have an price that they will eventually return to. So when the rate deviates from this value, there is an opportunity to potentially profit.
Keep reading to learn to find out how to effectively use this strategy to successfully navigate the markets.
Key takeaways
- Mean reversion trading strategy is based on the assumption that asset’s price movements will return to an average price.
- Prices tend to revert to the mean, which tells you what direction to trade Forex in.
- Mean reversion trading works most effectively when financial markets see extreme price moves.
What is mean reversion in trading?
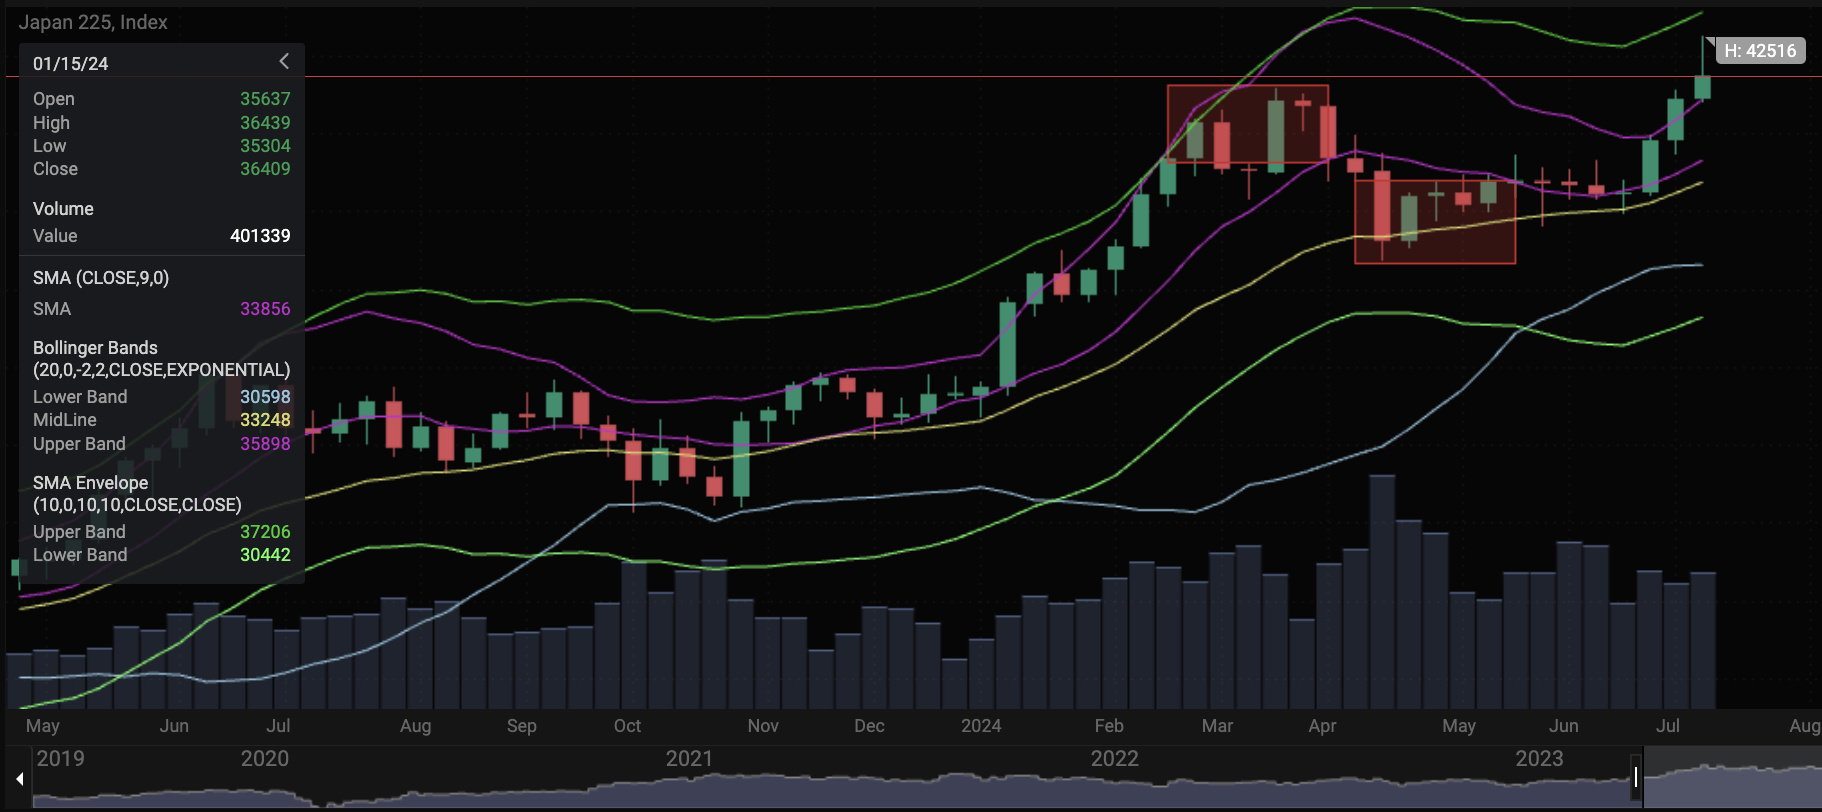
Calculating the mean is very simple; essentially, it is the average of an asset’s price data across a specific period of time. In fact, PrimeXBT gives you a straightforward way to plot this on your price chart with the SMA indicator (simple moving average). SMA is a line that shows the average of the prices across a sequence of price data.
In addition to SMA you can also use Bollinger bands, RSI or Envelopes to gather more information.. Bollinger Bands are indicators that include a SMA and two indicators a certain distance away from the center line. Envelopes are similar but only use two lines which encompass the average current market movements. RSI is a speed and momentum indicators that is used to assess whether an asset is overbought or oversold. RSI is displayed on a scale from 0-100 anything below 30 is considered oversold, and thus expected to increase in value and anything above 70 is considered overbought and is expected to drop in value.
When the price is above or below the SMA, or breaks through levels, you can enter a trade and exit the trade the closer it gets to the middle indicator line.

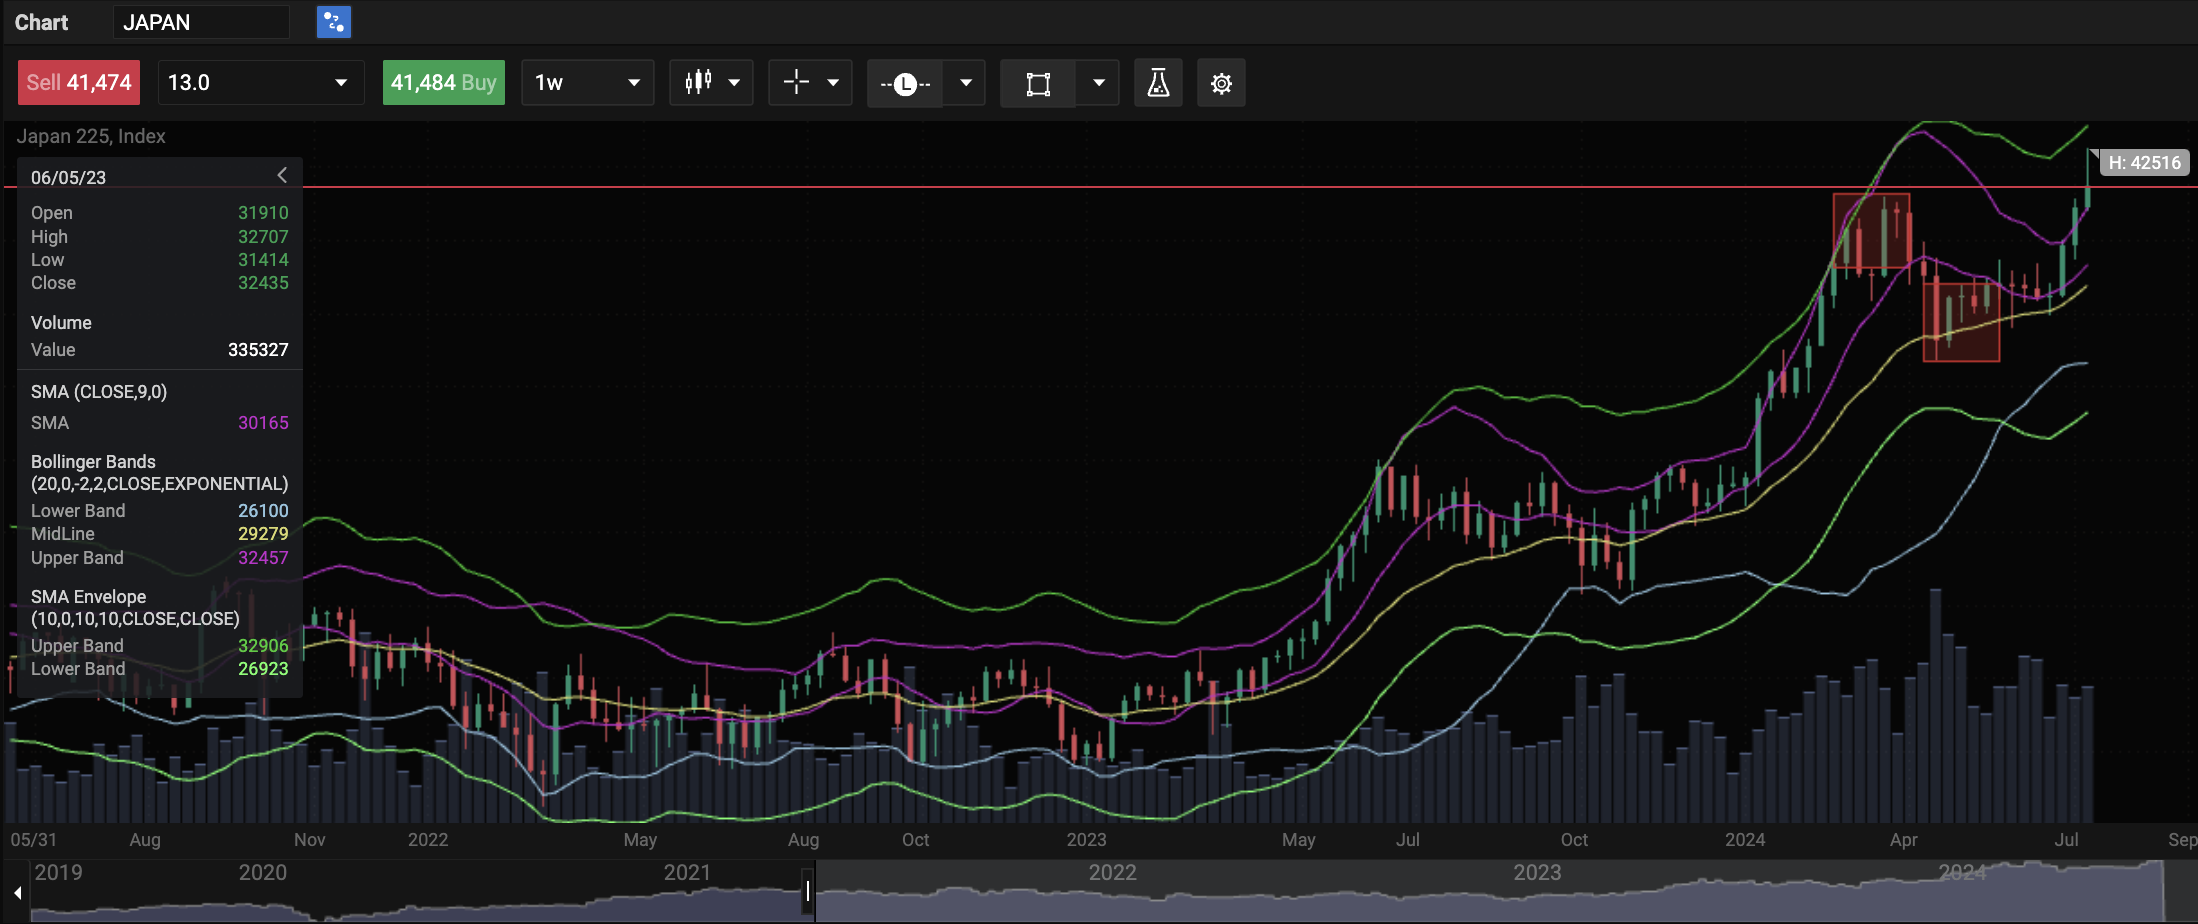
As you can see in the image above, SMA is in purple, SMA Envelope in light green and green, and Bollinger Bands in light blue, yellow, and dark purple. Highlighted in red squares are where the prices have deviated from the average value of the asset, in this case Japan 225. The picture below includes RSI which currently shows the instrument being slightly above oversold status.

In this case a mean reversion trader looking at RSI’s oversold status and price deviation from the mean, and likely decide to go long until the rate approaches the mean to close the trade.
What does each indicator do?
The SMA envelope can show many things. The closer to the upper band the price is, the stronger the trend. But the most valuable thing it can show you is how narrow or wide the envelope is. A wider envelope means more volatility. When the envelope narrows it means consolidation and contraction. When a trend consolidates, the price of the asset usually moves horizontally.
Bollinger bands are a bit more valuable in mean reversion strategies because they can show overbought and oversold conditions. They are usually composed of three lines; a moving average, and two lines that are a specified deviation above and below the center line.
RSI can also help you assess whether the underlying asset is oversold or overbought.
Does mean reversion work?
Mean reversion trading strategies usually give you pretty explicit exit points, since the closer you get to the average value or the average level, the higher the possibility of a cross-over event. This is especially true when the trending markets are experiencing a significant deviation from the historical average prices.
In the same light – it also gives you a relatively solid entry point. When you see the price move away from the moving average, and other indicators confirm that the trend has momentum, then you can enter. As the price goes through mean reversion, i.e. approaches the moving average, and you see the momentum indicator slowing, you can exit.
Mean reversion formula
You can manually calculate the average when mean reversion trading.
The formula for calculating mean reversion can be found below:
Mean = Prices Sum ÷ Number of intervals
Deviation = Price – Mean of Prices
Standard Deviation = Square Root (Sum of the Deviations Squared ÷ (Number of Observations−1))
Z Score = Deviation ÷ Standard Deviation
Of course, this process is greatly simplified with the Bollinger Band indicator. It will automatically do the calculations and display a line that you can use as visual representation when meaning reversion trading, plus two lines that represent the standard deviation away from the mean line.
Mean reversion trading strategies
Single asset strategies
It is very simple to use mean reversion trading with a single asset. When reversion trading, for example, let’s say, the stock market, if you notice a significant change in the asset’s value that isn’t backed by fundamental data, then it might indicate that the market is overvaluing or undervaluing the asset.
This also means that the price will return to its historical averages; if the price is above, you will go short. If the price is below, you would go long. In both cases, you must exit the trade before it touches or crosses the mean line.
Setting up stop loss and take profit is also simplified with the reversion trading strategy, since the area around your mean price is where you would exit, no matter the direction the market price is moving in. In both cases take profit would be set at a price that would break through the upper bands of the indicator you are using – either Bollinger Bands or Envelope.
Trading currency pairs and other multi-asset strategies
A bit more complex than single asset trading, currency pairs trading can help you take maximum advantage of market moves. In very simple terms, certain assets have a relationship. Either a positive or negative correlation. These correlated assets can be seen in almost all asset classes. There are even currency pairs that have a correlation within the same asset, like EUR/USD, where the two currencies are negatively correlated (meaning when one goes up the other goes down). However, this isn’t a perfect correlation.
An example of a perfect negative correlation is EUR/USD and USD/CHF. When one of the currency pairs increases the other drops. What does that mean for you? It means when you see the signs of opening a long position on one pair, you should check the other, which should give you a short opportunity.
Mean reversion trading system
MT5 is a very powerful platform that allows you to automate certain trading strategies including mean reversion trading strategies, and includes a huge list of technical indicators you can use directly from the user interface of the platform.
There are also numerous “off-shelf” strategies that users can apply without very extensive technical knowledge.
To completely automate the process, you will likely need to know MQL5, which is the platform’s own language used to code create expert advisors (robo-traders), automated technical analysis, and other scripts – including mean reversion trading.
Risk management techniques
As with any type of trading and investing, your strategy is only as good as your risk management. As markets can be unpredictable, your target shouldn’t be to succeed on every trade but to ensure that your losses don’t cause losses you can’t recover from.
A great way to protect your account is by using stop loss – which exits an open trade when it reaches a price threshold you set. In mean reversion trading, this threshold or limit is set close to the moving average price, or the line set by historical averages.
To protect trades when using mean reversion trading, your can use take profit orders. This type of order ensures that a trade is closed in profit to avoid a market reversal when the trend you are trading ends. In revision trading strategy, this means when the price starts approaching the mean line.
Summary
Overall, the mean reversion strategy is a viable and relatively straightforward way to trade and invest. Using the mean reversion theory that assumes assets return to their mean value after experiencing overbought or oversold conditions. This reversion is used to create profit, going short when the price falls and going long when higher prices are seen. This takes advantage of relatively predictable market conditions and financial theory that is used across multiple asset classes.
The mean reversion strategy uses various technical analysis tools such as Bollinger Bands, moving averages, and moving averages envelopes. Reversion traders will use these to see price deviations or range bound markets. A range bound market is a market in which a price is moving horizontally – banded within a range of prices.
Additionally, some reversion traders use pairs of financial assets that are correlated (i.e. relationships) so they can double the reversion opportunities. For example, if you are trading EUR/USD and USD/CHF, which move in opposite directions, you will see if one of the two is overbought, the other one is likely oversold.
So you could take advantage of a price movement in both directions, potentially doubling your return as the reversion to the mean takes place. And unlike trend following strategies, a mean reversion trading strategy gives you a very definitive line to base your entry and exit points on.
Finally, risk management. Controlling your financial market exposure can help you protect your assets and grow your portfolio. Any trading strategy you choose needs some sort of protection when markets move unpredictably. Some of the most powerful tools you have at your disposal are stop loss and take profit.
Is RSI a mean reversion strategy?
Although a reversion trader might think that RSI or Relative strength index shows overbought and oversold conditions (and it does), its originator meant it as a momentum indicator that shows the change of price and speed of a movement.
Is mean reversion a good strategy?
A good strategy really depends on the goals the trader seeks to achieve, their risk appetite and the market they are looking to trade. The mean reversion trading strategies are great when the market has over-valued or under-valued the underlying asset.
What is the win rate for mean reversion strategy?
The win rate of mean reversion strategies is subject to market conditions, portfolio composition and your strategy, but it is considered a popular way to trade.
The content provided here is for informational purposes only. It is not intended as personal investment advice and does not constitute a solicitation or invitation to engage in any financial transactions, investments, or related activities. Past performance is not a reliable indicator of future results.
The financial products offered by the Company are complex and come with a high risk of losing money rapidly due to leverage. These products may not be suitable for all investors. Before engaging, you should consider whether you understand how these leveraged products work and whether you can afford the high risk of losing your money.
The Company does not accept clients from the Restricted Jurisdictions as indicated in our website/ T&C. Some services or products may not be available in your jurisdiction.
The applicable legal entity and its respective products and services depend on the client’s country of residence and the entity with which the client has established a contractual relationship during registration.


