Bullish and bearish divergences are crucial ideas employed by technical analysts in the field of trading to spot probable changes in market patterns. They are founded on the examination of the connection between price changes and technical indicators. Explore each one separately:
Bullish Divergence: When an asset’s price makes a lower low but the associated indicator makes a higher low, there is a bullish divergence. This signifies that a downturn may be about to reverse and that positive momentum may be growing. It means that, despite the price decline, there is growing vigor or buying pressure. This is frequently interpreted by traders as a signal to close out short positions or contemplate opening long positions.
Bearish Divergence: On the other hand, bearish divergence occurs when an asset’s price makes a higher high while the indicator makes a lower high. This means that an uptrend may be about to reverse and that bearish momentum may be intensifying. It shows that even while the price is rising, there is growing selling pressure or weakness. This is frequently interpreted by traders as a signal to maybe open short positions or terminate long holdings.
These divergences are important because they can give traders forewarnings or signs about a future change in trend direction. Divergences allow traders to understand the underlying market dynamics and spot potential reversals before they are visible in price movement alone. Divergences should be used in conjunction with other technical analysis tools and indicators to verify prospective trading decisions because they are not failsafe indications.
Understanding the Basics of Divergence in Trading
Divergence, in the context of technical analysis, refers to a discrepancy or disagreement between the price movement of an asset and a related technical indicator. It occurs when the price and the indicator move in opposite directions or exhibit different patterns, indicating a potential shift in market dynamics.
The role of divergence in technical analysis is to provide traders with valuable insights into the underlying strength or weakness of a trend. It helps identify potential reversals or trend continuation patterns that may not be apparent from analyzing price action alone.
By comparing the price behavior with a chosen indicator, such as oscillators (e.g., the Relative Strength Index or Stochastic Oscillator) or moving averages, traders can gain a deeper understanding of market sentiment and make more informed trading decisions.
There is both bullish divergence and bearish divergence in the market, which offers the idea that perhaps the market is starting to show a lack of true momentum. Either can be a signal, as hidden divergences can often give a “heads up” on potential trend reversal set ups.
Divergence is frequently used by traders as a tool to support or evaluate prospective trend continuation or reversal patterns. These signals should not be depended upon alone, it is crucial to remember this. To maximize the likelihood of precise predictions, they should be used in conjunction with other analytic tools and indicators.
Popular Indicators for Spotting Bullish and Bearish Divergences
Traders frequently utilize a number of well-known technical indicators to identify divergences. Here are a few of them, along with an explanation of how they relate to divergence:
Relative Strength Index (RSI): RSI is a momentum oscillator that gauges how quickly and dramatically price movements change. It is often used to pinpoint overbought and oversold market circumstances and has a scale from 0 to 100. Traders search for bullish or bearish divergences between the RSI and the price when evaluating divergence. For instance, if the price makes a lower low but the RSI makes a higher low, this suggests a bullish divergence and points to the possibility of an upward trend reversal. In contrast, a bearish divergence and a potential trend reversal to the negative are indicated if the price makes a higher high while the RSI makes a lower high.
Convergence of Moving Averages Divergence (MACD): The MACD indicator, which consists of a histogram, two lines (the MACD line and the signal line), and follows trends. The MACD indicator is used by traders to spot shifts in momentum and potential trend reversals. Traders search for differences between the price and the MACD lines (MACD line and signal line) when evaluating divergence.
When the price makes a lower low but the MACD lines make a higher low, this is known as bullish divergence. This shows that the trend may be turning bullish. A potential bearish reversal is indicated by divergence, which happens when the price makes a higher high but the MACD lines make a lower high.
Stochastic Oscillator: Another momentum indicator, or oscillator used to detect overbought and oversold conditions is the stochastic oscillator. Two lines, %K and %D, which swing between 0 and 100, make up the structure. Traders concentrate on the connection between the Stochastic lines and the price when examining divergence.
When the price makes a lower low but the Stochastic lines make a higher low, this is known as bullish divergence. This shows that the trend may be turning bullish. A potential negative reversal is indicated by divergence, which happens when the price makes a higher high while the Stochastic lines make a lower high.
What is Bullish Divergence and How to Spot It?
Technical analysis’s key idea of bullish divergence suggests that the trend may be about to change from bearish to bullish. A related technical indicator forms a higher low while the price of an asset forms a lower low.
This mismatch implies that, despite the price’s decline, there is rising underlying buying pressure or momentum, which could indicate a change in the market’s sentiment. Here are the essential actions to take and indications of a bullish divergence utilizing common indicators:
- Lower low in price: The price should form a lower low, indicating a continuation of the downtrend.
- Higher low in the indicator: The selected indicator should form a higher low, indicating a shift in momentum or buying pressure. This could be the MACD indicator, Stochastic indicator, or the RSI indicator.
- Gradual or subtle divergence: Bullish divergence may not always be obvious and can sometimes appear as a subtle shift in momentum. It is important to be attentive and look for nuanced differences between the price and the indicator.
Real-World Examples of Bullish Divergence
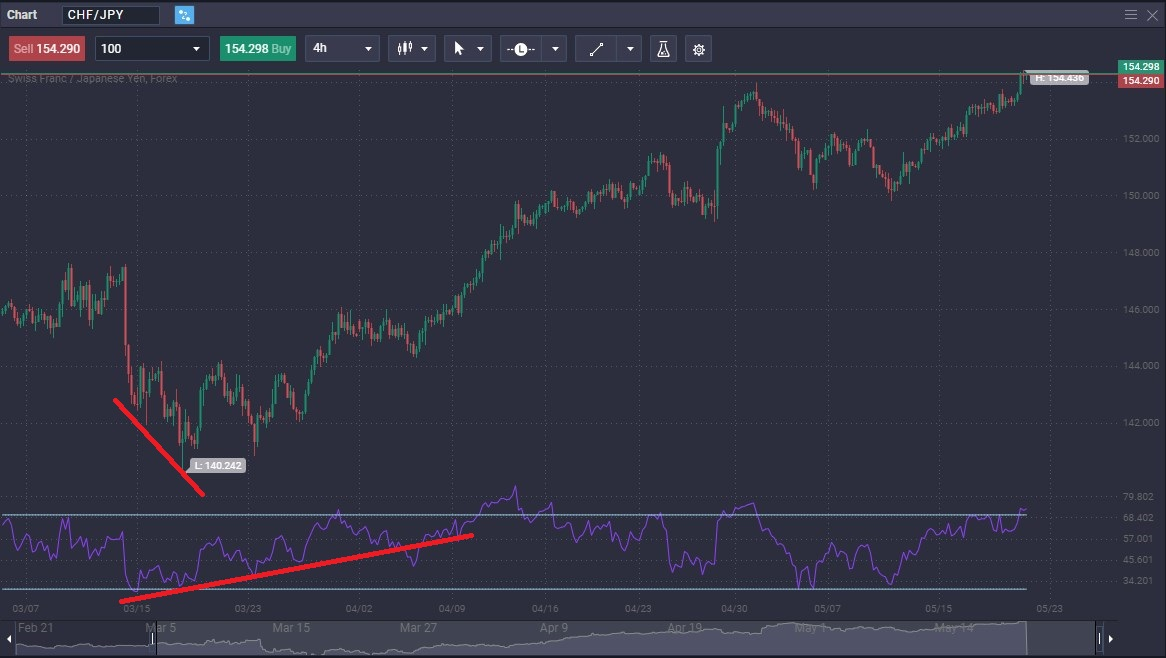
CHF/JPY Bullish Divergence:
Take a look at the following chart, as it shows the Swiss franc falling hard, while the RSI showed strength. This was the beginning of the turn around in this pair.

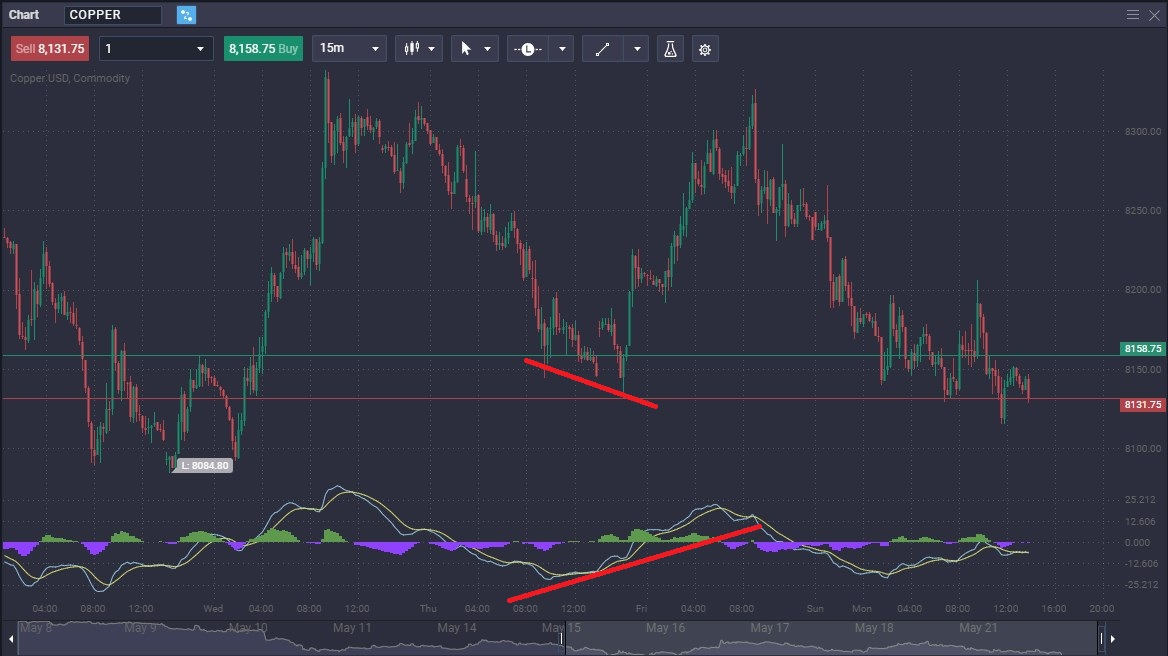
In this chart, the Copper market is falling, while the MACD is turning to the upside. This was a signal that the sellers were running out of strength.

What is Bearish Divergence and How to Spot It?
Technical analysis’s idea of “bearish divergence” denotes the possibility for a bullish trend to turn bearish. It happens when an asset’s price makes a higher high while a corresponding technical indicator makes a lower high.
This contrast implies that, despite the price increase, there is growing selling pressure or momentum, which could indicate a change in the mood of the market. Following are the primary indicators of a divergence utilizing common indicators:
- Higher high in price: The price should form a higher high, indicating a continuation of the uptrend.
- Lower high in the indicator: The selected indicator should form a lower high, indicating a shift in momentum or selling pressure.
- Gradual or subtle divergence: Divergence may not always be immediately evident and can sometimes appear as a gradual shift in momentum. Pay attention to nuanced differences between the price and the indicator.
Real-World Examples of Bearish Divergence
Euro 50 Bearish Divergence:
Take a look at this chart. It shows price continuing to go higher, while the RSI starts to drift lower, kicking off a selling opportunity.
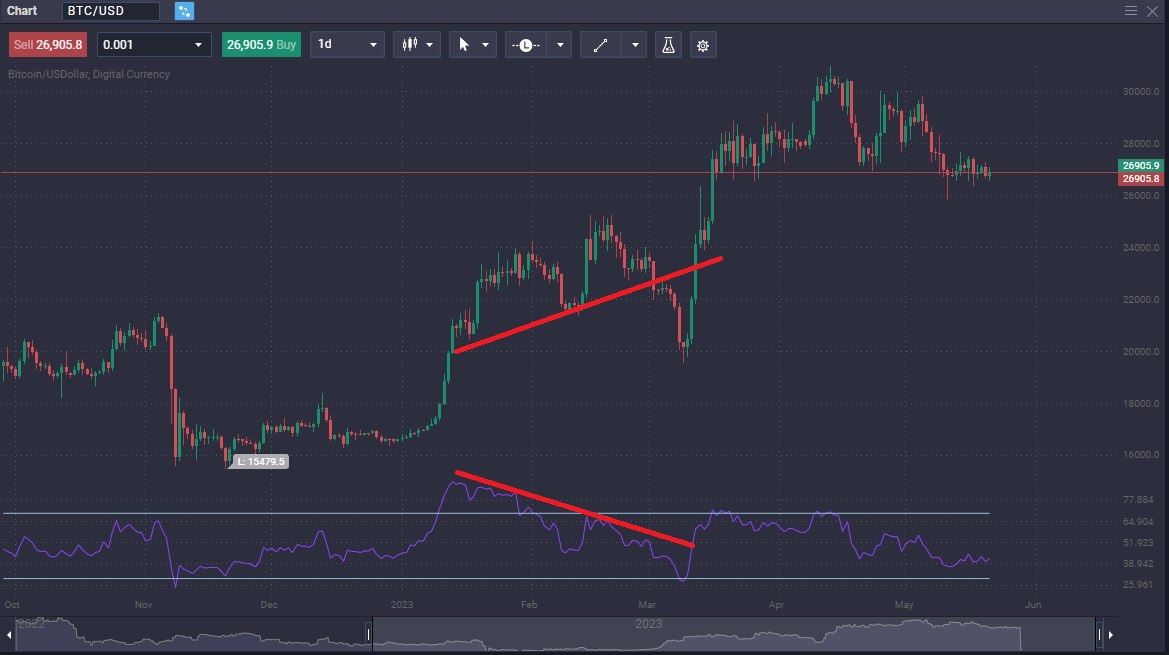
In the next chart, BTC/USD has been rallying for some time, but the RSI showed trouble. There was a pullback, before continuing the longer-term uptrend.

Case Study: Successful Trades Based on Divergence
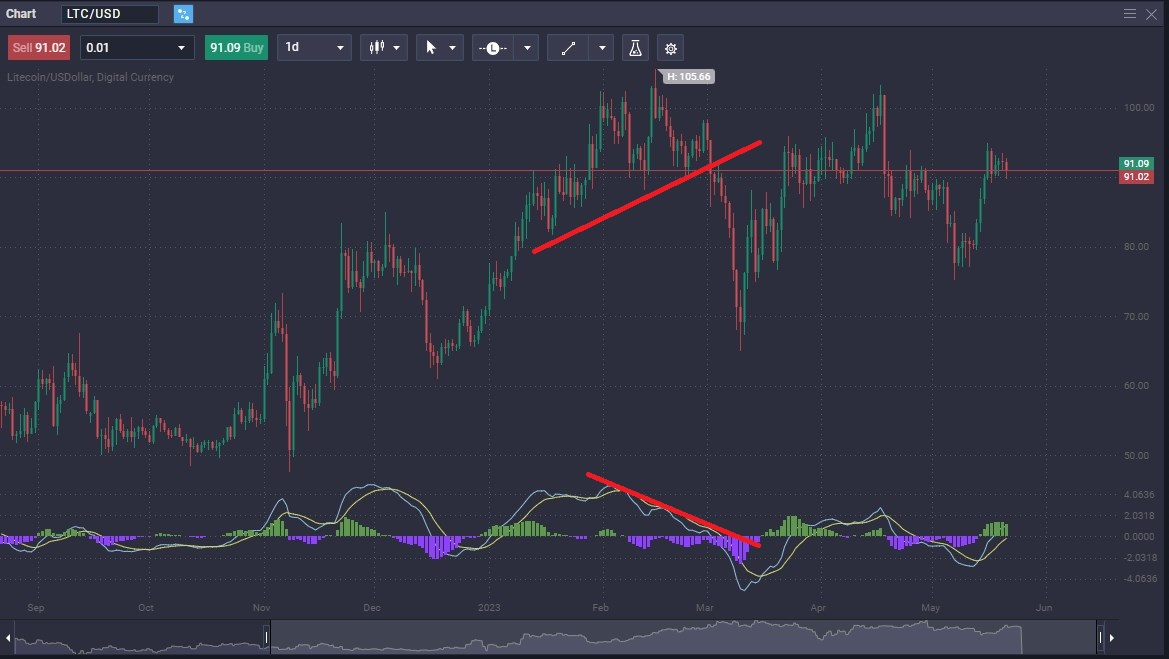
It is worth looking at a real-life set up to understand how this market signal can show that a move is coming. The Litecoin market spent most of the first two months of 2023 going higher, but the MACD started to drop.
A bit later, you can see a clear trendline break, as the MACD foretold. The MACD moving averages crossed again after a massive sell off. This was a sign that the market could be turning around again.

Trading Strategies Based on Bullish and Bearish Divergences
Trading Strategies Based on Bullish Divergence:
- Bullish Reversal Strategy: Traders can enter long positions when a bullish divergence is identified, expecting a potential trend reversal from bearish to bullish. The benefit of this strategy is the potential to capture early trend reversals and ride the subsequent upward price movement. However, the risk lies in false trade set ups, where the price continues to decline despite the bullish divergence, resulting in potential losses.
Trading Strategies Based on Bearish Divergence:
- Bearish Reversal Strategy: Traders can enter short positions when a bearish divergence is identified, anticipating a potential trend reversal from bullish to bearish. The benefit of this strategy is the opportunity to profit from downside price movements. However, the risk lies in false set ups, where the price continues to rise despite the divergence, leading to potential losses.
- Trend Continuation Strategy: Traders can use bearish signals as an indication of a potential pause or slowdown in an ongoing uptrend. They may choose to tighten stop-loss levels, take partial profits, or refrain from entering new long positions until the price confirms the divergence signal. This strategy allows traders to manage risk and potentially stay in profitable trades, but there is a risk of missing out on further price appreciation if the trend continues.
Common Mistakes When Trading Based on Divergences
Common Errors When Using Divergences in Trading:
- Misinterpretation of Signals: Traders may misinterpret divergence signals, leading to incorrect trading decisions. They might confuse regular fluctuations with true divergences or fail to consider other factors that confirm or invalidate the divergence. This can result in entering trades prematurely or missing potential opportunities.
- Over-Reliance on a Single Indicator: Relying solely on a single indicator for divergence signals can be risky. Different indicators may provide conflicting signals, and using only one may lead to false positives or false negatives. Traders need to consider multiple indicators and corroborate signals with other analysis tools for confirmation.
Tips to Avoid Mistakes:
- Use Multiple Indicators: Combine different indicators to validate divergence set ups. Look for convergence among indicators to strengthen the reliability of the signal. This helps reduce the risk of false signals and provides a more comprehensive view of the market dynamics.
- Confirm with Price Action: These signals should be confirmed by analyzing price action. Look for additional confirmation through trendlines, chart patterns, support/resistance levels, or volume analysis. Price confirmation adds robustness to divergence signals and enhances the probability of accurate predictions.
- Consider Market Context: Divergence signals should be evaluated within the broader market context. Consider the prevailing trend, market conditions, and potential fundamental factors that might influence the asset. These signals are more reliable when they align with the overall market sentiment.
- Practice Risk Management: Implement proper risk management techniques such as using stop-loss orders, setting realistic profit targets, and managing position sizes. These signals are not infallible, and losses can occur. Effective risk management helps protect against potential losses and ensures longevity in trading.
Conclusion: Mastering Divergence for Enhanced Trading Decisions
Divergence trading and trading hidden divergence patterns can be a useful indicator as to where the markets are going. However, they should never be taken as the sole reason for entering a trade.
In the end, the entire idea behind a divergence trading strategy is that you are entering a trade as the market is starting to shift directions. This can lead to losses if you are not careful, so money management will continue to be paramount when using this technique.
There are multiple indicators that you can use, and it is important that you test out each one to determine which divergences you prefer trading, and with what indicator. Demo trading is crucial, and will give you the data necessary to take advantage of this phenomenon.
What if i see bearish divergence and hidden bullish divergence?
It can be a sign that we could be getting ready for a trend change. However, the signal itself shouldn't be the sole reason you take a trade.
Make sure that you have plenty of reasons to enter or exit a trade, and that trading divergences is part of a larger trading strategy.
Does hidden divergence work?
It can. It is yet another tool in a trader's toolbox.
How do you confirm hidden bearish divergence?
Normally you can confirm hidden bearish divergence by using other indicators, or even price action that confirms the signal.
What causes bearish divergence?
The market will sometimes show momentum indictors slowing down, while the price of a market is going higher. This can be a sign that a reversal could be coming.
However, it is vital that traders don't trade only on regular and hidden divergence alone. Make sure you have other reasons to enter or exit a trade.
The content provided here is for informational purposes only. It is not intended as personal investment advice and does not constitute a solicitation or invitation to engage in any financial transactions, investments, or related activities. Past performance is not a reliable indicator of future results.
The financial products offered by the Company are complex and come with a high risk of losing money rapidly due to leverage. These products may not be suitable for all investors. Before engaging, you should consider whether you understand how these leveraged products work and whether you can afford the high risk of losing your money.
The Company does not accept clients from the Restricted Jurisdictions as indicated in our website/ T&C. Some services or products may not be available in your jurisdiction.
The applicable legal entity and its respective products and services depend on the client’s country of residence and the entity with which the client has established a contractual relationship during registration.


